Multifamily Financing Rates: Today’s Ranges By Loan Type
Multifamily financing rates shift constantly based on loan type, property size, and market conditions. Whether you're acquiring your first 5-unit building or refinancing a 200-unit complex, the rate you'll pay depends heavily on which lending program fits your deal. Agency loans, bank portfolio products, FHA/HUD programs, and bridge financing all come with distinct pricing structures, and knowing where each one lands today can save you tens of thousands over the life of your loan.
At David Roa, we've funded over $150 million in loans across residential, commercial, and investment properties over 25+ years. A significant portion of that volume comes from real estate investors building multifamily portfolios, clients who need accurate rate information to make acquisition and refinancing decisions that pencil out. We work with DSCR loans, hard money, and conventional programs daily, which gives us a front-row view of where rates actually close, not just where they're advertised.
This guide breaks down current multifamily financing rates by loan type, from Fannie Mae and Freddie Mac products to HUD 223(f) loans and short-term bridge options. You'll see typical rate ranges, understand what drives pricing differences, and learn which programs make sense for specific investment strategies. By the end, you'll have the numbers you need to compare your options and move forward with confidence.
Why multifamily financing rates change daily
Multifamily financing rates move constantly because lenders price your loan against securities that trade in real time. Unlike a fixed mortgage rate that locks for 30 days, the underlying bonds that fund multifamily loans fluctuate based on economic data, Federal Reserve policy, and investor demand. When you call for a rate quote on Monday morning, that number could shift by Tuesday afternoon if treasury yields spike or new employment numbers come out stronger than expected. Lenders reprice their rate sheets multiple times per day to stay aligned with the secondary market where they sell or securitize your loan.
Market forces beyond your control
The 10-year U.S. Treasury yield serves as the baseline for most multifamily loan pricing. When that yield climbs, your rate climbs with it. Treasury movements respond to inflation reports, unemployment data, and Federal Reserve statements about future monetary policy. A single jobs report showing higher-than-expected wage growth can push yields up half a percentage point in a matter of hours, which translates directly to higher borrowing costs for your next acquisition or refinance.
Geopolitical events also create volatility. Trade disputes, international conflicts, or banking crises abroad drive investors toward or away from U.S. bonds, which shifts yields and cascades into multifamily loan pricing. You don't control these macro factors, but they determine whether your rate quote stays valid or expires before you can lock it in.
Investor appetite for mortgage-backed securities
Fannie Mae and Freddie Mac securitize most of the multifamily loans they purchase, packaging them into bonds that institutional investors buy. When demand for these mortgage-backed securities (MBS) is strong, spreads tighten and your rate improves. When demand weakens because investors chase higher yields elsewhere, spreads widen and your rate climbs. This demand shifts daily based on competing investment options, credit spreads, and overall market sentiment.
Lenders also watch the TBA (to-be-announced) market where forward MBS contracts trade. Pricing in the TBA market signals where rates are heading in the near term. If TBA prices drop, lenders adjust their rate sheets upward to protect their margins before they sell your loan into the secondary market. This adjustment happens in real time, which explains why a rate you saw yesterday may no longer be available when you call today.
Multifamily rates don't sit still because the bonds backing them trade continuously. Locking your rate quickly when conditions favor you protects your deal from negative swings.
Your property and profile impact daily pricing
Beyond macro factors, your specific loan request affects the rate you receive on any given day. A 75% loan-to-value deal on a stabilized property prices better than an 80% LTV request on a value-add asset with deferred maintenance. Lenders adjust for risk in real time, and their appetite for higher-risk profiles fluctuates based on how much capital they've already deployed that month and what their current pipeline looks like.
Your credit profile, liquidity, and experience managing similar properties also factor into daily pricing adjustments. A borrower with $2 million in reserves and a track record of successful repositioning projects gets better execution than a first-time investor stretching to 80% leverage. Lenders tighten or loosen these credit overlays daily based on their internal risk targets and how many loans they need to close before quarter-end. Rate sheets reflect these shifts, which means the price you qualify for today depends on both market conditions and where your deal sits in the lender's current priority queue.
The benchmarks that drive multifamily rates
Lenders price multifamily financing rates against specific financial benchmarks that move independently of the Federal Reserve's short-term interest rate decisions. Understanding these benchmarks helps you interpret why your loan officer quotes a different rate today than last week, even when the Fed hasn't changed policy. The spread between the benchmark and your actual rate reflects lender profit margins, loan risk, and market liquidity, but the benchmark itself sets the floor for all pricing conversations.
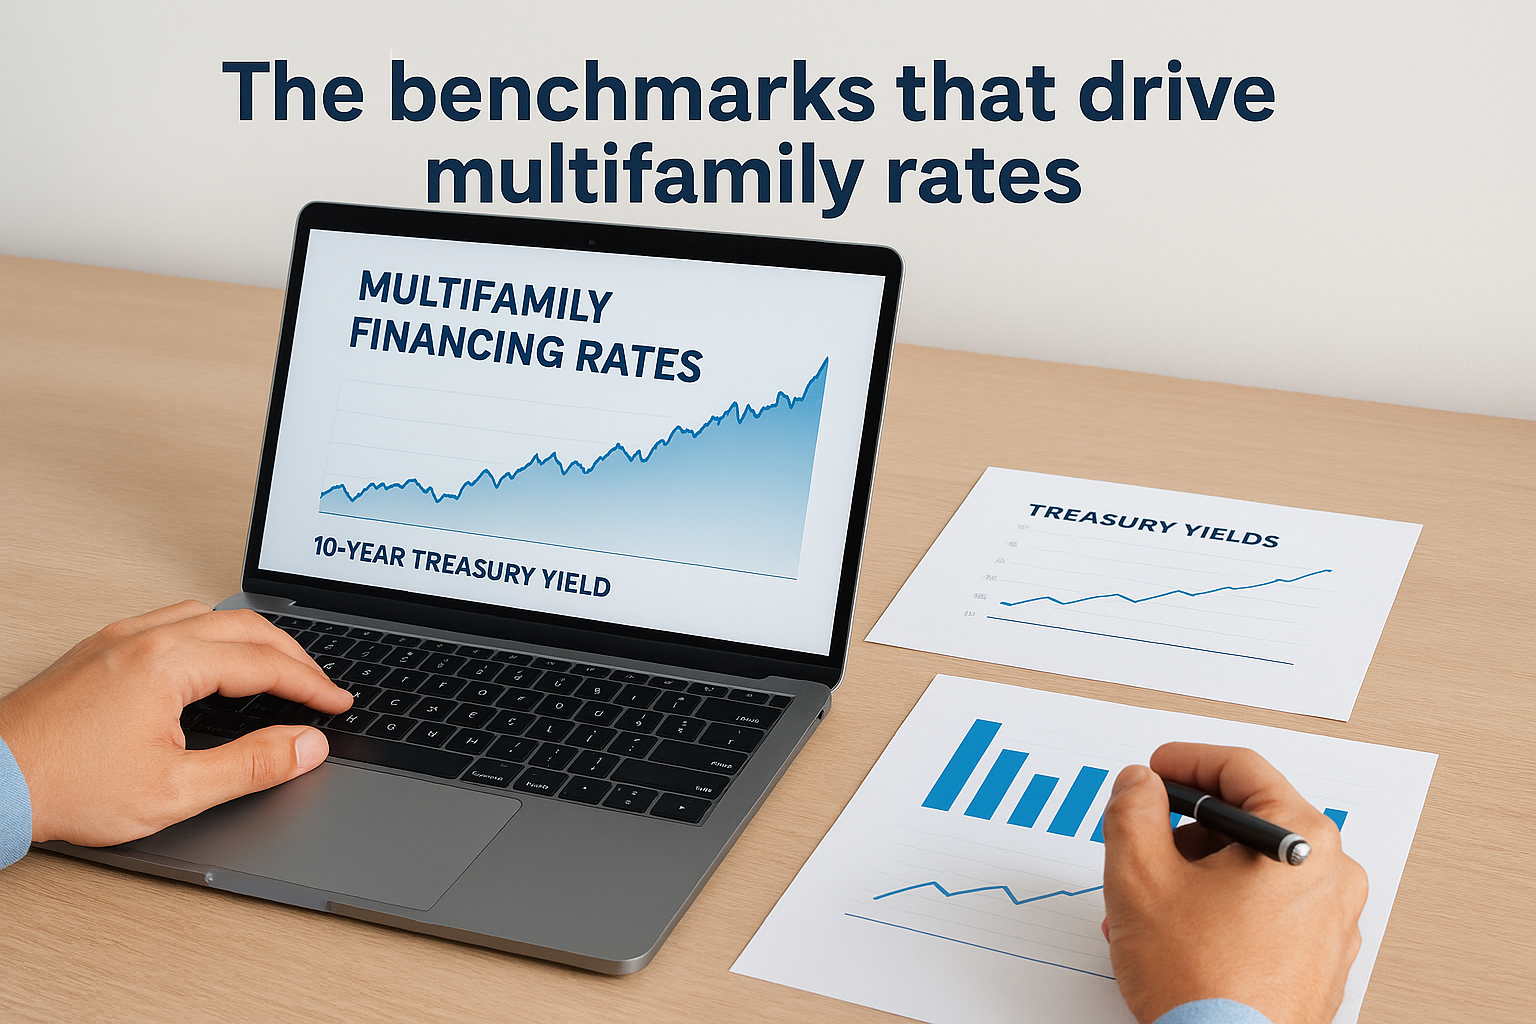
Treasury yields as the baseline
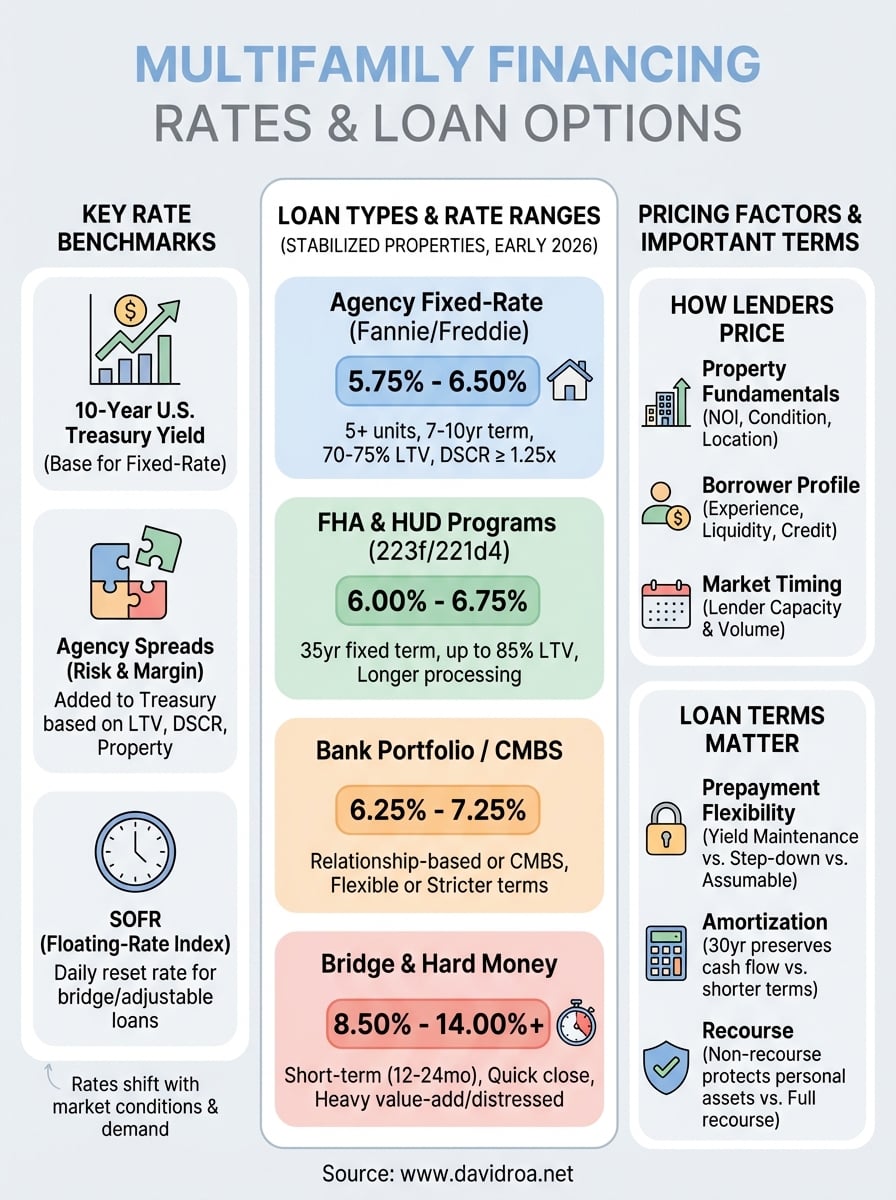
The 10-year U.S. Treasury yield serves as the primary reference point for most fixed-rate multifamily loans. When you request a Fannie Mae or Freddie Mac loan with a seven or ten-year term, lenders start with the current 10-year Treasury rate and add their spread on top. This benchmark captures investor expectations for inflation and economic growth over the next decade, which directly impacts how much institutional buyers will pay for the mortgage-backed securities your loan eventually becomes.
Daily movements in the 10-year Treasury filter through to your rate quote within hours. If the Treasury yield jumps from 4.2% to 4.5% based on a strong jobs report, your multifamily loan rate will climb by roughly the same amount plus any adjustment in the lender's spread. You can track this benchmark yourself through financial news sites to understand when conditions favor locking your rate versus floating longer.
Agency spread pricing
Fannie Mae and Freddie Mac add a spread over Treasury yields to cover their operational costs, credit risk, and profit margins. This spread typically ranges from 150 to 250 basis points (1.5% to 2.5%) depending on your loan-to-value ratio, debt service coverage, and property type. A stabilized 100-unit property at 65% LTV commands a tighter spread than a value-add project at 75% LTV with recent vacancy issues.
Agency spreads widen during market volatility and tighten when competition for loan volume heats up. Your timing affects which end of that range you pay.
SOFR and floating-rate products
The Secured Overnight Financing Rate (SOFR) replaced LIBOR in 2023 as the benchmark for adjustable-rate and bridge loans. SOFR tracks the cost of overnight borrowing backed by U.S. Treasury securities, which makes it a transparent, manipulation-resistant index for short-term financing. Bridge lenders typically quote rates as SOFR plus 400 to 600 basis points, depending on the loan size and property risk profile. This benchmark resets daily, so your interest payment fluctuates with short-term market conditions throughout your loan term.
Today's multifamily rate ranges by loan type
Multifamily financing rates vary significantly across lending programs, with spreads of 200 to 400 basis points between the most aggressive agency products and short-term bridge loans. The ranges below reflect rates closing in early 2026 for stabilized properties with strong debt service coverage and experienced borrowers. Your actual rate depends on property condition, location, leverage, and whether you're buying or refinancing.
Agency fixed-rate loans
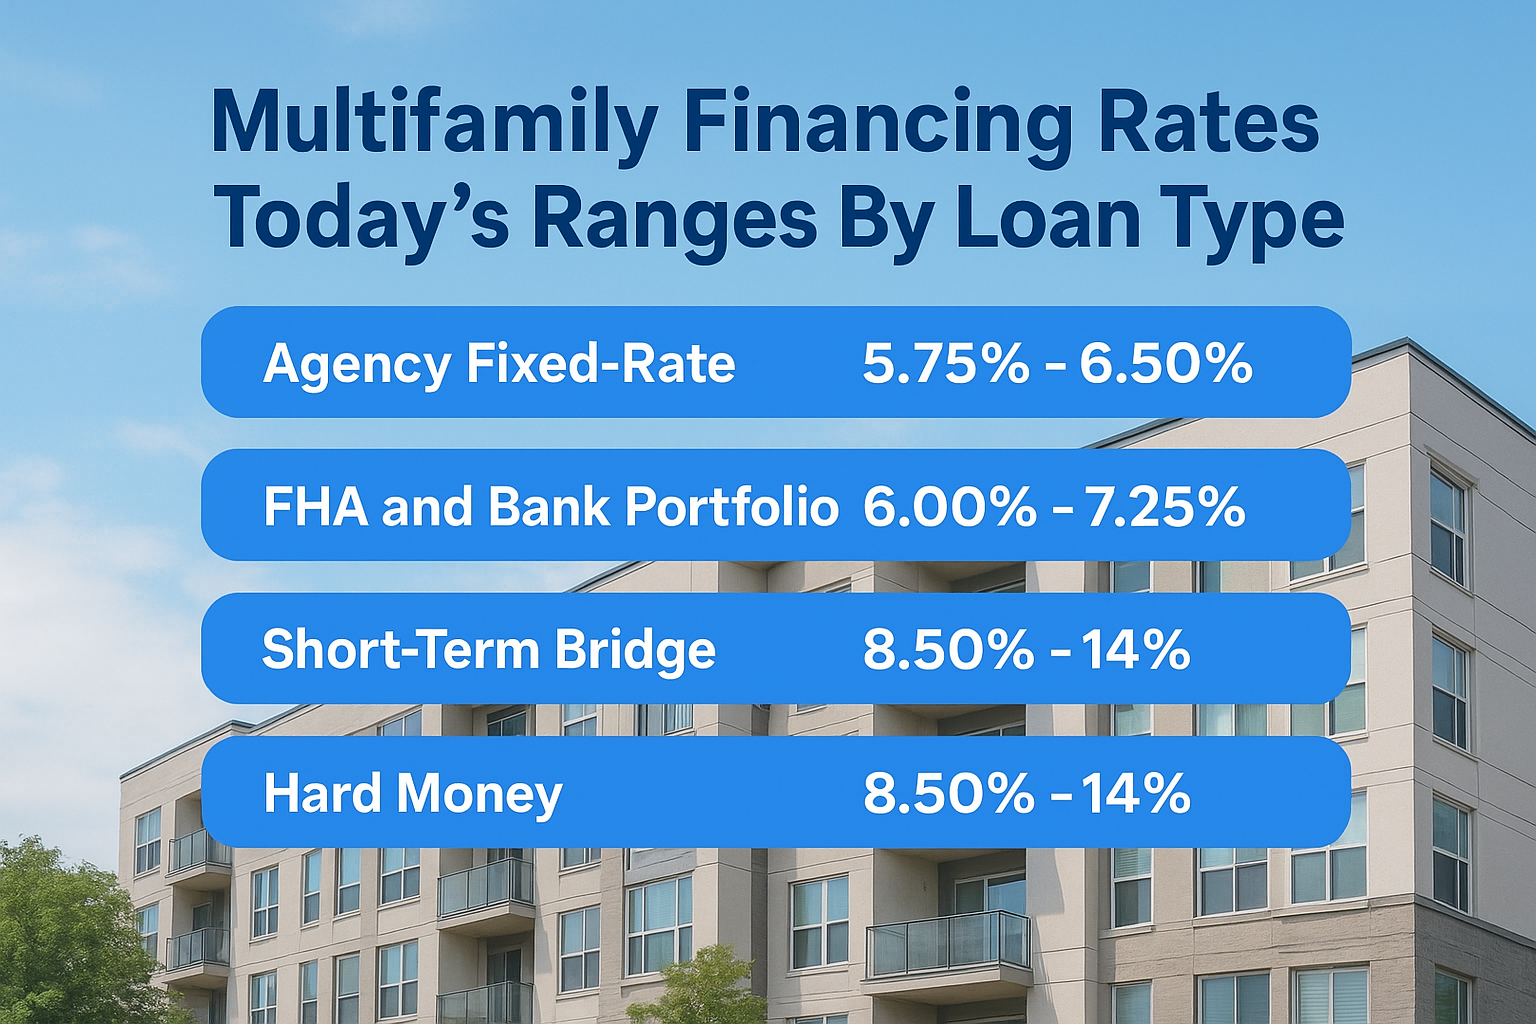
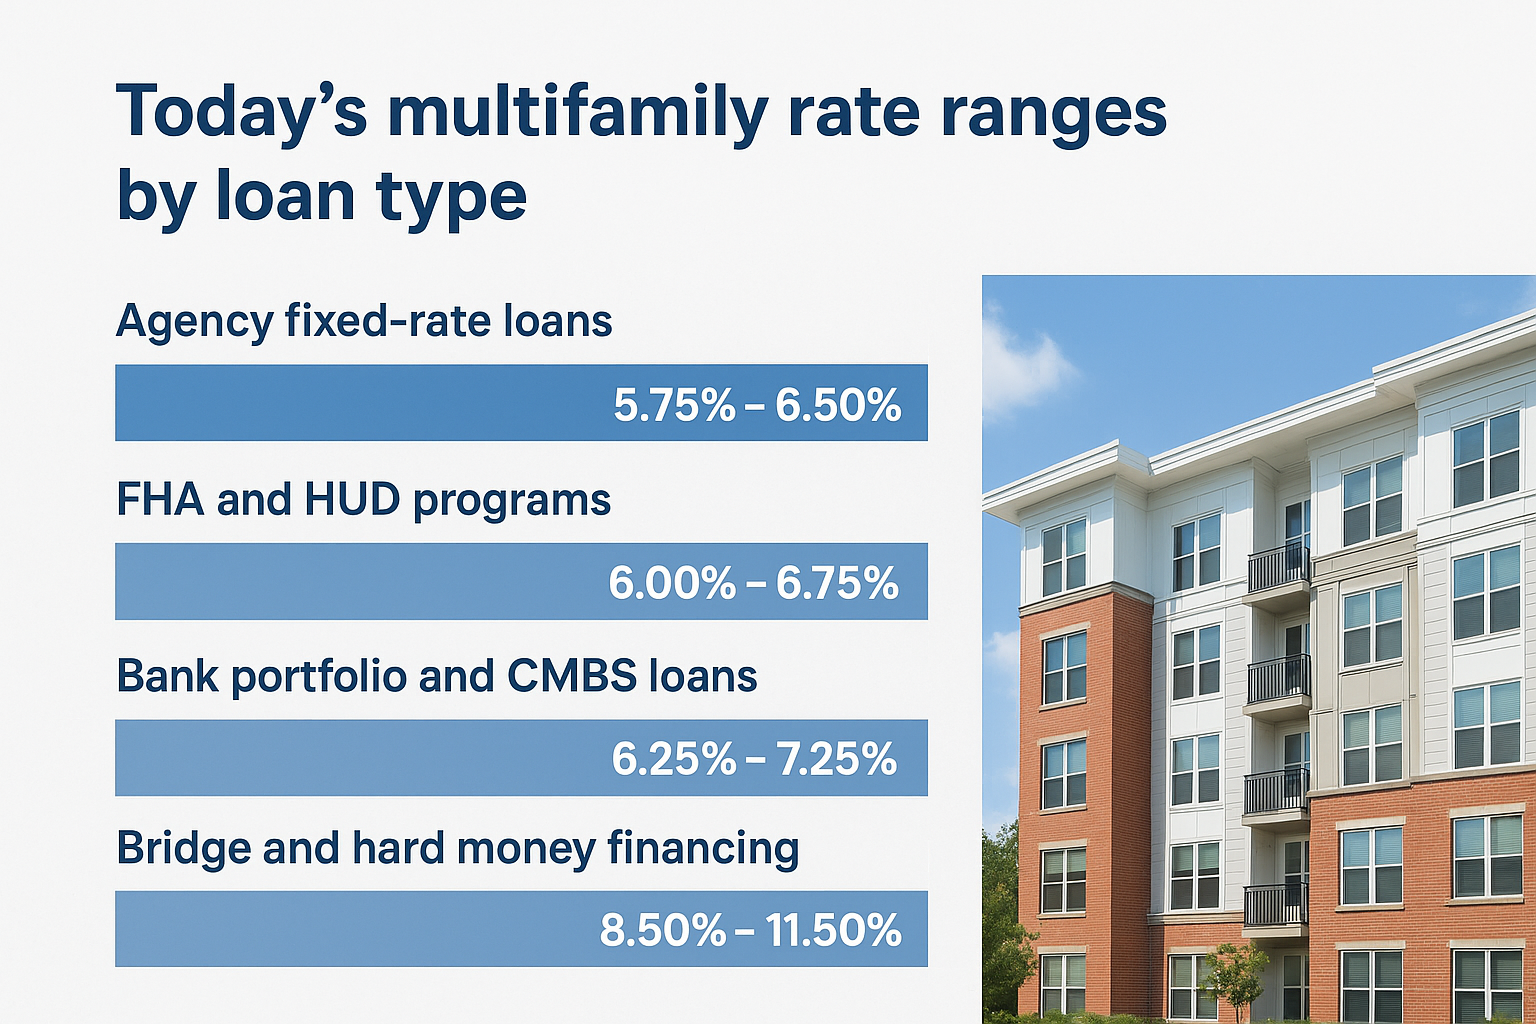
Fannie Mae and Freddie Mac offer the lowest rates for multifamily properties with five or more units. You'll find rates between 5.75% and 6.50% for seven or ten-year fixed terms on stabilized assets at 70% to 75% loan-to-value. Properties with 50+ units typically price at the lower end of this range, while smaller 5 to 20-unit buildings carry slightly higher rates due to perceived concentration risk. Your debt service coverage ratio needs to hit at least 1.25x to qualify for the best execution.
Agency rates deliver the most competitive pricing when your property shows consistent occupancy and your borrower profile includes multifamily experience.
FHA and HUD programs
FHA 223(f) loans for acquisition or refinancing of stabilized properties currently range from 6.00% to 6.75% for 35-year fixed terms. HUD 221(d)(4) construction loans price similarly but require substantial development experience and longer processing times. These programs allow leverage up to 85% for nonprofits and 83% for market-rate properties, which explains the modest rate premium compared to agency products. You'll wait 90 to 180 days for approval, but the combination of high leverage and long amortization makes these rates competitive for deals that support affordable housing components.
Bank portfolio and CMBS loans
Regional and national banks offer portfolio loans with rates between 6.25% and 7.25% depending on relationship strength and property quality. Banks price aggressively for borrowers who maintain operating accounts, deposit relationships, or other commercial products with their institution. CMBS loans fall into a similar range but carry stricter prepayment penalties that lock you in for the full term. You gain flexibility with bank portfolio products because they don't securitize your loan, which allows for modifications if your property plan changes.
Bridge and hard money financing
Short-term bridge loans range from 8.50% to 11.50% based on SOFR plus spreads of 400 to 700 basis points. Hard money products for heavy value-add or distressed properties push higher, sometimes reaching 12% to 14% when leverage exceeds 75%. These rates reflect the lender's liquidity risk and the property's current cash flow challenges. You pay this premium for speed and flexibility, closing in 10 to 21 days versus 45 to 90 days for agency or bank financing.
How lenders price your deal
Lenders calculate your multifamily financing rates by evaluating three core dimensions: the property itself, your financial profile, and their current lending capacity. Each factor carries weight in the final pricing decision, and understanding how lenders score these elements helps you position your deal for the best execution. A strong property with weak sponsorship prices worse than a mediocre asset backed by an experienced borrower with substantial liquidity, which shows that lender confidence in your ability to perform matters as much as the bricks and mortar.
Property fundamentals that move your rate
Your property's net operating income (NOI) drives the first pricing conversation because it determines how much debt the asset can support. Lenders calculate your debt service coverage ratio by dividing NOI by your proposed annual debt payment. A DSCR of 1.35x earns you better pricing than a deal scraping by at 1.20x coverage because the lender sees more cushion against vacancy or expense spikes. Properties in high-growth markets with strong employment fundamentals command tighter spreads than comparable buildings in stagnant or declining areas.
Physical condition and age factor heavily into rate decisions. A recently renovated 20-unit building with updated systems prices 50 to 75 basis points lower than a similar property needing deferred maintenance work. Lenders discount rates for properties with in-place institutional leases and penalize those with high tenant turnover or below-market rents that signal upcoming capital requirements.
Property risk directly translates to rate premiums, so addressing deferred maintenance before you apply improves your pricing and approval odds.
Your borrower profile and track record
Your experience managing multifamily properties shapes how aggressively lenders price your deal. A borrower who has successfully stabilized three value-add projects over the past five years receives better terms than someone acquiring their first apartment building, even when the properties match perfectly. Lenders review your historical performance, payment records on existing loans, and your ability to execute business plans on time and within budget.
Liquidity requirements vary by loan program, but showing six to twelve months of reserves for the subject property plus your entire portfolio demonstrates staying power when occupancy dips or expenses spike. Strong reserves justify lower rates because lenders see reduced default risk when you can cover shortfalls from personal funds rather than immediately facing cash flow stress.
Market timing and lender capacity
Lenders adjust pricing based on how much volume they've already committed that quarter and whether they need to hit production targets before month-end. You might receive a rate 25 basis points better in late March when a lender needs two more deals to close than you would in early April after they've met their quota. This timing dynamic creates opportunities for borrowers who can move quickly when lenders have capacity to fill.
Loan terms that matter as much as the rate
Focusing only on multifamily financing rates without examining the loan structure costs you money and flexibility over the life of your financing. A loan at 6.25% with a five-year lockout period and full-term amortization delivers worse total returns than a 6.50% loan with flexible prepayment options and a 25-year amortization that preserves your monthly cash flow. Lenders design loan terms to protect their investment timeline and maximize their yield, which means you need to negotiate these provisions as aggressively as you negotiate the rate itself.

Prepayment penalties and exit flexibility
Your ability to refinance or sell without massive penalties determines your real cost of capital when market conditions shift. Yield maintenance and defeasance structures on agency loans can cost you hundreds of thousands of dollars if you exit early, even when rates drop and refinancing makes financial sense. Step-down prepayment penalties that decline annually give you more control over your exit timing, typically starting at 5% in year one and dropping to 1% by year five.
Some lenders offer assumable loans that let a buyer take over your existing financing, which creates value when you sell in a rising-rate environment. This assumability feature attracts stronger buyer pools and supports higher sale prices because the buyer preserves your below-market rate instead of financing at current higher rates.
Amortization schedules that impact cash flow
A 30-year amortization versus a 25-year schedule reduces your monthly debt payment by 8% to 12%, which directly improves your property's cash-on-cash return. Longer amortization protects you during lease-up periods or when you're executing value-add renovations that temporarily reduce occupancy. Lenders price longer amortization with slightly higher rates, but the monthly payment relief often justifies paying 10 to 15 basis points more upfront.
Extended amortization schedules preserve capital for renovations and operating reserves, which matters more than saving fifty basis points on your rate when you're repositioning a property.
Recourse versus non-recourse structures
Non-recourse loans limit your personal liability to the property itself, protecting your other assets if the deal fails. Agency loans typically offer non-recourse structures with standard carve-outs for fraud, misrepresentation, and environmental issues. Bank portfolio loans often require full recourse, which means the lender can pursue your personal assets beyond the property if you default. This recourse requirement justifies demanding a rate discount of 25 to 50 basis points because you're taking substantially more risk than you would with a non-recourse agency product.
How to compare offers like a pro
Collecting three or four multifamily financing rates from different lenders means nothing if you can't identify which offer delivers the best total cost and strategic fit for your deal. Most borrowers compare only the interest rate and miss loan terms that add thousands of dollars in hidden costs or restrict their ability to execute their business plan. You need a systematic approach that evaluates rate, fees, prepayment flexibility, and timeline together so you choose the financing that maximizes your returns instead of just accepting the lowest advertised rate.
Build a standardized comparison spreadsheet
Create a simple spreadsheet that captures every material term from each lender's proposal on a single row. Include the interest rate, origination fee, third-party costs, required reserves, debt service coverage ratio used in underwriting, and loan-to-value ratio. Add columns for prepayment penalty structure, assumability, recourse versus non-recourse, and amortization period because these factors affect your monthly payment and exit strategy. This format lets you spot which lenders are quoting apples and which are quoting oranges, preventing you from choosing a 6.00% loan that costs more overall than a 6.25% loan with lower fees and better terms.
A structured comparison framework reveals total financing costs that headline rates hide, protecting you from choosing the wrong lender based on incomplete information.
Calculate true all-in cost per loan
Your effective rate includes the stated interest rate plus all upfront fees amortized over your expected hold period. A loan at 6.25% with zero points beats a 6.00% loan with two points if you plan to refinance in three years, but loses if you hold for ten years. Divide total fees by your hold period in months, then add this monthly cost to your interest expense to see your true monthly debt service. This calculation shows which offer costs less over your actual ownership timeline instead of relying on the lender's advertised rate that ignores fee impact.
Pressure test prepayment scenarios
Request detailed prepayment penalty schedules from each lender showing exactly what you'll pay to exit in years one through five. Map these costs against your likely refinancing or sale timeline to understand which loan gives you flexibility when you need it. A loan with step-down penalties that drop to 1% by year three costs less if you sell early than a loan with yield maintenance that could hit you with a six-figure penalty even when rates haven't moved in your favor.
Common scenarios and which loan fits best
Matching your deal to the right financing program saves you money on multifamily financing rates and prevents approval delays caused by applying to lenders who don't fund your property type. Each lending product targets specific acquisition strategies, property conditions, and borrower profiles, which means the fastest path to closing comes from knowing which programs align with your current situation before you submit applications. Understanding these common scenarios helps you skip lenders who can't help you and focus on programs designed for exactly what you're trying to accomplish.
First-time acquisition with limited reserves
Agency products work best when you're buying your first 5 to 20-unit building with stable occupancy and you can put down 25% to 30%. Fannie Mae Small Loans and Freddie Mac's targeted affordable programs offer the lowest rates at 5.75% to 6.50% while accepting thinner reserve requirements than larger portfolio loans. You'll need a credit score above 680 and proof you can manage the property, which lenders verify through property management experience or partner credentials.
FHA 223(f) loans let you stretch to 85% loan-to-value if your building serves workforce housing tenants and meets affordability requirements. You'll wait longer for approval and pay slightly higher rates than agency products, but the reduced down payment frees up capital for reserves and minor improvements after closing.
Value-add repositioning project
Bridge financing at 8.50% to 11.50% gives you the speed and flexibility you need when you're buying a property with deferred maintenance or below-market rents that require immediate attention. These loans close in 10 to 21 days and allow you to fund renovations through built-in improvement budgets or supplemental funding tranches. You pay higher rates because lenders price in the execution risk of your business plan until you stabilize occupancy and refinance into permanent financing.
Bridge loans cost more upfront but deliver the capital and timeline flexibility required to execute value-add strategies that agency lenders won't touch until you prove stabilization.
Hard money products push rates to 12% to 14% when your property needs heavy rehab or you're acquiring through foreclosure with title issues that take time to clear. You accept these rates because traditional lenders reject the deal completely, and your profit from repositioning covers the higher interest expense during your 12 to 24-month hold period.
Cash-out refinance on stabilized property
Agency refinancing delivers the best execution at 5.75% to 6.50% when you've owned the property for at least two years and can show 12 months of seasoned operating history at current performance levels. Lenders will refinance at 75% of current appraised value, which lets you pull equity out for acquisitions while locking in long-term fixed rates that protect you from future market volatility.
Next steps
Understanding multifamily financing rates across different loan programs gives you the foundation to evaluate which financing structure supports your acquisition or refinancing goals. You've seen how agency products, FHA loans, bank portfolio options, and bridge financing each serve specific property types and borrower profiles, with rates spanning from 5.75% to 14% depending on your deal's risk profile and timeline. The lowest advertised rate rarely delivers the best total cost when you account for fees, prepayment penalties, and loan terms that either support or restrict your business plan.
Your next move depends on getting accurate pricing for your specific property and financial profile. Generic rate ranges help you budget, but your actual approval terms come down to how lenders evaluate your deal against their current lending appetite and underwriting standards. Contact David Roa to review your multifamily financing options with a lender who has closed over $150 million in investment property loans and understands how to position your deal for the best execution.